2020 has been a time of rapidly evolving information, with data visualisations used as an important means of understanding the spread and prevalence of COVID-19. Efforts are being made around the world to ensure that people who are blind or have low vision are able to access the same information.
Data tables and graphs
Accessible data tables
The Accessible COVID-19 Statistics Tracker by Tyler Littlefield gives up-to-date data on the spread of coronavirus as simple, easy to navigate data tables. This includes global statistics on total cases, deaths, active cases and recoveries; along with statics by country.
The Australian Government’s “Coronavirus Australia” app, free for download on apple and android devices, gives the number of confirmed cases in each Australian state as a list under “Current Status”.
Descriptions
The Australian Government Department of Health website provides meaningful descriptions of the trends and data shown in their Coronavirus at a glance infographic on the current COVID-19 situation in Australia. It is updated daily at 3pm.
Note: The PDF graphic for download is inaccessible. Instead, stay on the web page and skip to “Description:” at the end of the page.
Sonifications
Our team at Monash University has created the following sonifications, best heard using stereo headphones or speakers.
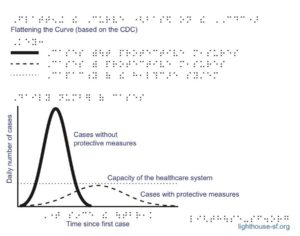
Flattening the curve
On the left we hear the curve (number of active cases) without protective measures as a siren, with higher pitch indicating more cases. White noise static comes in when the healthcare system exceeds capacity.
On the right we hear the curve with protective measures as a choir. The white noise static fades in as the healthcare system approaches its capacity but fades out quickly.
COVID-19 cases in Australia from 24 February to 20 April 2020
A week is marked with a ‘Grandfather clock’ in all of these sonfications for COVID-19 cases in Australia from 24 February to 20 April 2020.
Active cases are the metallic ‘glockenspiel’ in the left speaker:
Recoveries are the ‘harp’ in the right speaker:
Deaths are ‘bleeps’; between 1 and 7 notes per beat:
Active cases, recoveries and deaths are also given together:
Spread of infection worldwide from 21 January to 25 March
Professor Pedro Rebelo from the Sonic Arts at the Sonic Arts Research Centre, Queen’s University Belfast, has produced a sonfication using sound to illustrate the spread of COVID-19 infection and deaths using WHO data from 21 January to 25 March 2020. Further information and the sonification are available at http://www.qub.ac.uk/sarc/research/Covid-19DataSonification65/.
Tactile graphics to print or emboss
 Naomi Cogan Rosenberg of the Lighthouse for the Blind and Visually Impaired has created a series of tactile graphics on COVID-19 that can be printed onto swell paper or embossed using a ViewPlus Tiger embosser.
See https://drive.google.com/drive/u/0/folders/1L3Gvw4uuAoZWTv5i2iIT1f2HRYW6boMF for tactile graphics illustrating the concept of flattening the curve, speed of spread, symptoms, total number of cases by location, and instructions on how to print/emboss them.
Desmos “flattening the curve” graphic
The concept of “flattening the curve” is also explained and illustrated using a Desmos accessible graph.
SAS accessible graphs and maps
SAS is a data analytics software, transforming data into information graphics to help aid understanding and decision making. The SAS Graphics Accelerator is a free plugin for Google Chrome created by SAS to enable people who are blind or have low vision to gain interactive access to such graphics. On behalf of the SAS accessibility team, Ed Summers has created free sample accessible data visualisations about coronavirus (COVID-19) that support alternative presentations such as enhanced visual rendering, text descriptions, tabular data, and interactive sonification. You must download the SAS Graphics Accelerator in order to use these graphics.

See https://support.sas.com/misc/accessibility/Samples/COVID-19/index.html for instructions on how to use the graphics and links to the sample graphics: bar charts depicting locations with the most confirmed cases overall, confirmed cases in the last 5 days, deaths and deaths over the last 5 days; maps showing confirmed cases, deaths and death rate; and time series line graphs showing total confirmed cases vs death rate for the world, Canada, China, Italy, Spain and the USA.
Enquiries can be sent to accessibility@sas.com
Structure of the virus
 This tactile graphic is designed to be printed on swell paper. It gives a COVID-19 structure tactile graphic with labelled components.
A 3D printable model of the virus created by Sean Tikkun is available for download and printing.
For a more fun activity, you may like to make your own paper-mache COVID-19 pinata and then smash it to pieces!
Daily living advice
Advice on daily living practices during the COVID-19 pandemic, including advice that is specific for people with a vision impairment, is given at http://accessiblegraphics.org/covid-19living/.