Sonification refers to the conversion of data to non-speech audio. It is used in mainstream devices to convey critical information without requiring attention to a screen, for example the heart rate monitor, the Geiger counter, sonar and auditory cockpit displays. For people who are blind or have low vision, sonification offers the advantages of independent, remote access to data without the need for expensive equipment, and the ability to quickly gain an overview of the data.
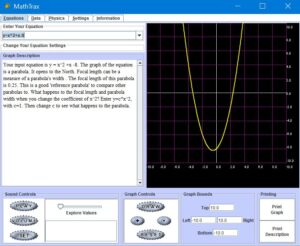
The main application of sonification for people who are blind or have low vision is in conveying graphs, where the y-axis is represented as pitch and the x-axis is represented by time. Software and apps designed for BLV people to access graphs or data sets through sonification include the Desmos free online graphing calculator’s audio trace feature, MathTrax software by NASA, and the SAS Graphics Accelerator Chrome extension for more advanced users.
Some other good examples of sonification include:
- NASA sounds from around the milky way – The translation begins on the left side of the image and moves to the right, with the sounds representing the position and brightness of the sources. The light of objects located towards the top of the image are heard as higher pitches while the intensity of the light controls the volume. Stars and compact sources are converted to individual notes while extended clouds of gas and dust produce an evolving drone. The crescendo happens when we reach the bright region to the lower right of the image. This is where the 4-million-solar-mass supermassive black hole at the center of the Galaxy, known as Sagittarius A* (A-star), resides, and where the clouds of gas and dust are the brightest.
- The weather machine gives a snapshot of chosen weather conditions in chosen locations and allows you to move forward hourly through the forecast