There are many different methods for accessing graphics available to people who are blind, have low vision or a print disability. In selecting a method, consideration must be given to the individual, their skills and experience, available resources, the type of diagram and the purpose of the diagram.
These are some of the main methods in which graphics can be made accessible:
- enlargement
- verbal description
- written description
- image recognition
- GraVVITAS
- sonification
- tactile graphics (pre-prepared)
- tactile graphics (ad-hoc)
- 3D models (3D printed)
- 3D models (ready made)
Englargement
Suitability: Users with sufficient usable vision. Original image must be high quality with good contrast.
Advantages:
- original graphic can be used without modification
- image can be accessed independently by the student
Disadvantages:
- can cause headaches or fatigue
- can be difficult to gain an overview or navigate
Resources required:
- large screen
- software, e.g. ZoomText
- magnifier
- desk space
Verbal description
Suitability: Information graphics where spatial layout is unimportant.
Example diagrams:
- single-path flow charts
- infographics
- concept maps
- cartoons
- illustrations
Advantages:
- advance preparation not required
- recipient has the opportunity to seek clarification
- can also be useful for other students in an educational setting
Disadvantages:
- does not allow independent access to information, and cannot be reviewed later
- not suitable for conveying spatial information
- often requires subject-matter expertise
Resources required: time of a sighted person with subject matter expertise
Written description
Suitability: Information graphics where spatial layout is unimportant.
Example diagrams:
- single-path flow charts
- infographics
- concept maps
- cartoons
- illustrations
Advantages:
- quick to produce
- can be reviewed at any time
Disadvantages:
- needs to be prepared ahead of time
- not suitable for conveying spatial informatin
- often requires subject-matter expertise
Resources required: time of sighted person with subject matter expertise and training in provision of diagram descriptions
Image recognition
Image recognition software or apps give a brief description of a photograph. Most are automated and a low level of detail is given.
Suitability: blind users working independently (at home, university or in the workplace) needing to determine whether an image can be ignored or contains important information and should be requested in an accessible format.
Advantages:
- quick
- portable
- can be used independently
- cheap
Disadvantages:
- does not give access to information in the graphic; only gives an indicator of whether the graphic is important enough to pursue in another format
- can be inaccurate
Resources required: software or app, e.g. TapTapSee
Note: IRIS is an image recognition app specifically for maths and science materials, currently in beta testing.
GraVVITAS
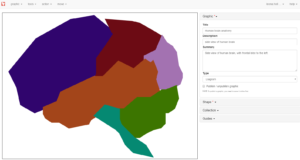
GraVVITAS encompasses a free authoring tool and iOS app for creating and accessing simple diagrams with touch-activated audio labels.
Suitability: Simple diagrams with important spatial information and/or lengthy labels
Example diagrams:
- multiple-path flow charts
- simple maps
- tables
- Gantt charts
- graphs (line, bar, pie or scatter)
Advantages:
- cheap
- portable
- able to convey spatial information
- quick and easy to produce
- graphs can be created from an equation or data, enabling independent access
Disadvantages: cannot convey fine detail
Resources required:
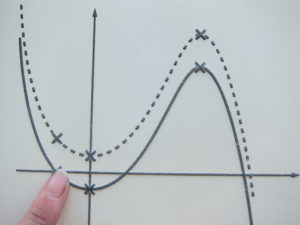
Sonification
 Sonification software converts data to audio tones.
Example diagrams: graphs from an equation or data
Advantages:
- quick
- cheap
- enables independent access
Resources required: software, e.g. MathTrax or Desmos free accessible graphics calculators
Tactile graphics (pre-prepared)
Tactile graphics are also known as raised line drawings.
Suitability: Ideal format for diagrams with important spatial information, but can also be used for most other diagrams.
Example diagrams:
- maps
- graphs
- complex flow diagrams
- shapes, angles and geometry
- technical drawings
Advantages:
- able to convey spatial information
- can be combined with print for people with low vision
- high quality
Disadvantages:
- expensive
- time-consuming to produce
- requires specialist equipment
- tactile reading skills required (this must be taught and maintained by exposure to tactile graphics)
- bulky
Resources required:
- graphics software for image design, e.g. CorelDraw, Illustrator, Inkscape, Word or PictureBraille
- specialist equipment, e.g. braille embosser, swell machine)
- specialist supplies, e.g. braille or swell paper
- time of a skilled tactile graphics transcriber
Tactile graphics (ad hoc)
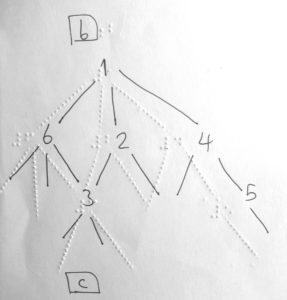
Suitability: Diagrams with a spatial component, required quickly without a high level of accuracy.
Example diagrams:
- simple graphs
- flow or process diagrams
- shapes, angles and geometry
Advantages:
- cheap
- quick
- able to convey spatial information
- independence: blind users are able to produce or modify their own drawings
Disadvantages:
- not durable
- limited labelling
- tactile reading skills required (this must be taught and maintained by exposure to tactile graphics)
Resources required:
- equipment and supplies, e.g. tactile drawing board, thick paper, tracing wheel, string with glue, sticky dots, etc.
- time for diagram production
3D models (3D printed)
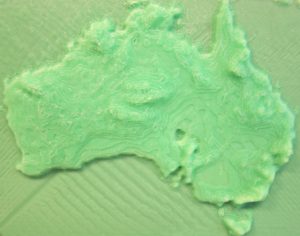
Suitability: Representation of 3-dimensional objects that are not readily available for touch.
Example diagrams:
- anatomy
- 3D graphs
- geographic data
- landforms
- maps
- buildings
- any other objects too large, to small, too dangerous, too delicate or too rare to touch
Advantages:
- easier to understand than tactile graphics
- highly engaging for both the vision impaired user and their sighted peers
- designs for many commonly desired models are available for free
Disadvantages:
- long print time (up to 24 hours)
- time and expertise required to create new models
- bulky
- difficulty with labelling
Resources required:
- 3D printer and materials
- 3D design software, e.g. TinkerCad or SketchUp (free)
- 3D model online repositories, e.g. Thingiverse (free)
- time and expertise to design new models
3D models (ready made)
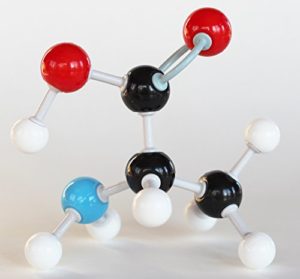
Suitability: 3D model is readily available or 3-dimensionality is important.
Example diagrams:
- anatomy models
- chemistry models
- geometric shapes
- equipment
Advantages:
- may be readily available
- can also be useful for sighted peers
Disadvantages:
- bulky
- difficulty with labelling
- may be expensive or time-consuming to obtain
Last updated: February 17, 2021 at 10:19 am